Building my self-hosted monitoring tool
As part of my home lab / personal security stack, I wanted visibility into my own infrastructure if a service goes down or becomes unreachable, I want to know before a customer does (Availability principle).
Uptime Kuma is an easy-to-use self-hosted monitoring tool, so I used it to build my own external monitoring and alerting pipeline.
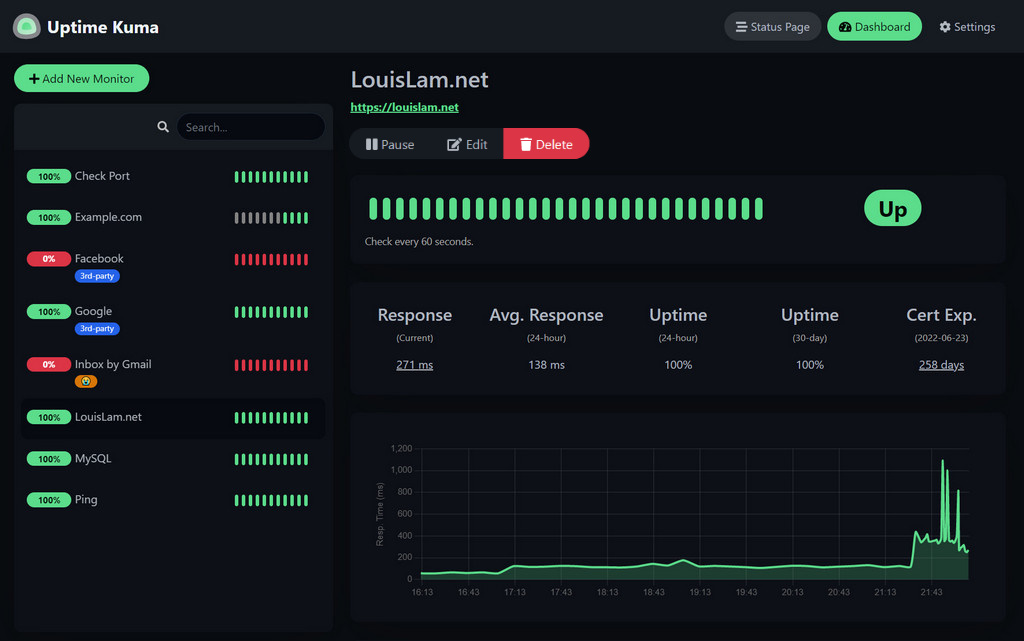
Step 1: Uptime Kuma on Proxmox (the core piece)
Proxmox has a library of community scripts that build a ready-to-use LXC container (a lightweight VM) with Uptime Kuma already installed. This saves me time from manually installing Debian, Node.js, etc.
- Proxmox web UI → click your node → Shell (top right)
- Paste and run:
Before I hit enter, a quick note on trust; and one I apply to every script I run on infrastructure I care about: this pulls a script from GitHub and executes it directly. It's a well-known, widely-used community project (thousands of stars, transparent source), but as a security-minded practice I always treat "curl/wget into bash" one-liners as something to verify first. The same instinct I'd apply to any third-party binary or supply-chain dependency.
- Answer its prompts (default settings are fine)
- It builds the LXC + installs Uptime Kuma + gives me a URL at the end
Note: At the end, it prints something like:
I copy that IP down; I'll need it in the next step.
Once that finishes, I opened http://<that-ip>:3001 in my browser it showed me an Uptime Kuma setup screen asking me to create an admin username/password.
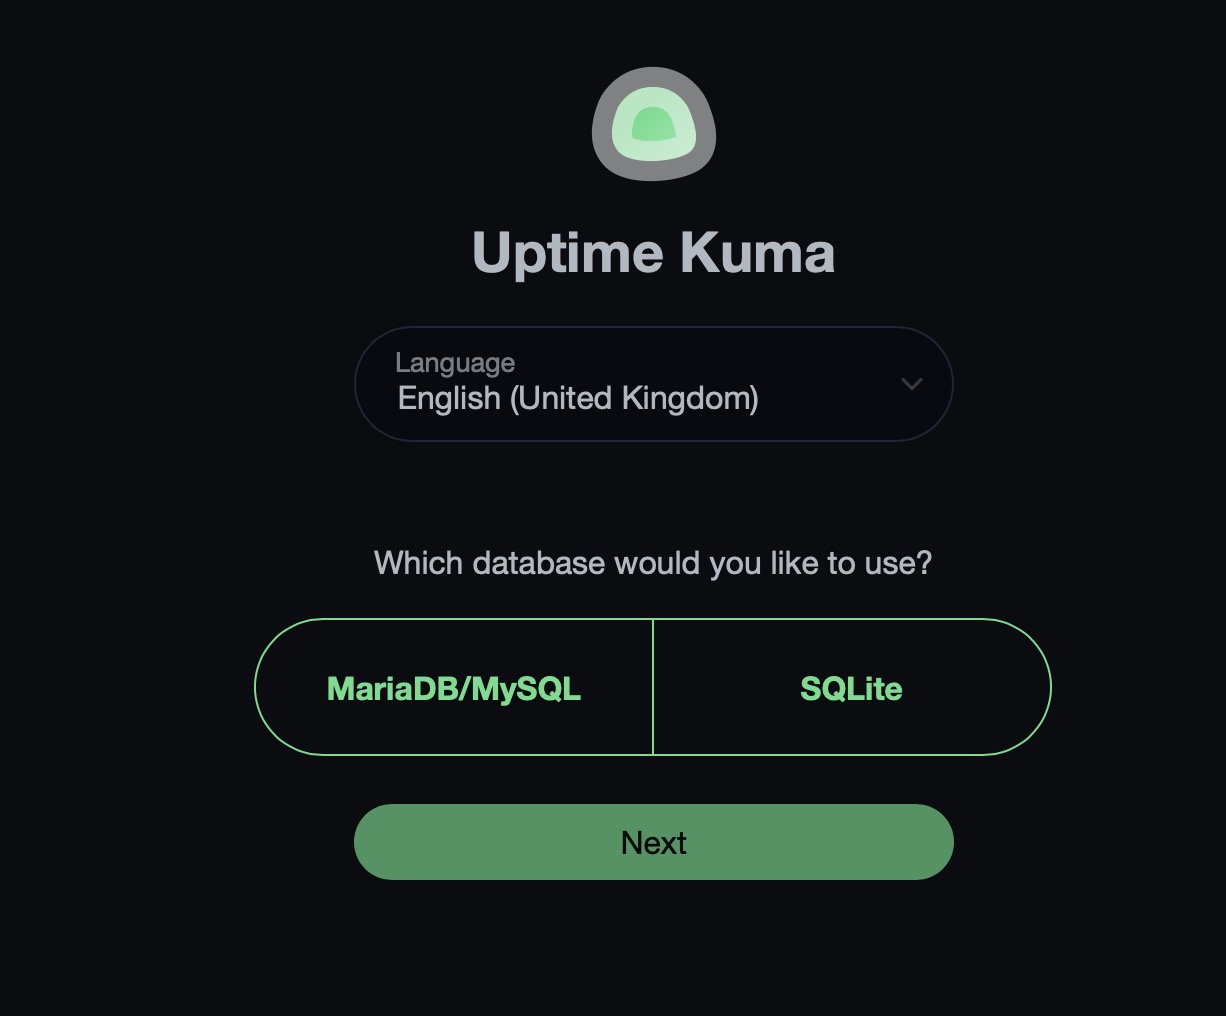
Why I chose SQLite?
- Uptime Kuma is a lightweight monitoring tool a handful of monitors pinging every 60s.
- SQLite needs zero setup, no separate database container, no credentials to manage, no extra service that can itself become an additional attack surface or point of failure.
- One less moving part = one less thing to secure, patch, and monitor (ironic to add a whole database server to a tool whose job is watching for things breaking).
- Backups are just copying one file (
kuma.db), which also makes it trivial to include in my regular backup/recovery routine.
Step 2: I set up Telegram notifications
I wanted alerts pushed to me in near real time rather than having to check a dashboard, so I wired Uptime Kuma into Telegram as my out-of-band notification channel.
Step 2.1: I find and open BotFather
- On Telegram I tap the search and type:
BotFather - I look for the one with the blue verified checkmark official username is exactly
@BotFather(I watch out for fake lookalikes without the checkmark, since impersonation of BotFather is a known phishing vector) - I tap it to open the chat
Step 2.2: I start the conversation
- I type
/startand send it - BotFather replies with a menu of commands it understands
Step 2.3: I create my bot
- I type
/newbotand send it - I follow the instructions (it asks for a display name, then a username ending in
bot)
Step 2.4: I get my token
If the username is available, BotFather replies with a success message containing something like:
Step 2.5: I send my bot a message
- In Telegram, I search for the username I just gave my bot
- I open the chat with it
Step 2.6: I get my chat_id
- I open a browser (on my phone or laptop, doesn't matter)
- I go to this URL, replacing
<TOKEN>with my actual bot token from before:
- For example, if my token is
123456789:ABCdefGHIjklMNOpqrsTUVwxyz, the URL would be:
- I get back a block of JSON. I look for the
"chat"object insideresult[0].message.chatthe number next to"id"there is my chat_id, e.g."chat":{"id":987654321, ...}. I copy that number.
Step 2.7: I add the Telegram notification in Uptime Kuma
- I open Uptime Kuma in my browser:
http://<your-lxc-ip>:3001 - I log in with the admin account I created
- I click my profile icon (top right) → Settings
- In the left menu, I click Notifications
- I click Setup Notification (or the "+ New" button)
Step 2.8: I fill in the notification form
- Notification Type → I select Telegram from the dropdown
- Friendly Name → anything, e.g. Telegram Alerts
- Bot Token → I paste my token (the
123456789:ABCdef...string) - Chat ID → I paste my chat_id number
- Toggle "Apply on all existing monitors" → I turn this ON (so any monitor I already made, or make later, uses it automatically saves me re-adding it each time)
Step 2.9: I test it
- I click the Test button before saving
- I check my Telegram, I get a message from my bot within a few seconds, something like "Uptime Kuma Alert Testing"
- I save
Step 3: I add monitors in Uptime Kuma
I add two monitors to start: one checks if my cloud itself is responding, the other checks if my whole VPS is reachable at all. Having both matters: it tells me what broke and from a security standpoint, an unexpected reachability change on either one is also a useful early signal of something worth investigating (misconfiguration, outage, or otherwise).
Monitor 1: my cloud (HTTPS check)
- In Uptime Kuma, I click + Add New Monitor
- Monitor Type → HTTP(s)
- Friendly Name → MyCloud
- URL → my cloud's address, e.g.
https://my-domain.com - Heartbeat Interval → 60 (seconds)
- Retries → 2 (avoids a false alert on one blip)
- Heartbeat Retry Interval → 30
- I scroll to Notifications → I make sure my Telegram notification toggle is ON (it should be, since I applied it to all monitors)
- I click Save
Monitor 2: Server reachability (TCP/Ping check)
- I click + Add New Monitor again
- Monitor Type → TCP Port (or Ping — TCP on port 22 is usually more reliable since some hosts block ICMP ping)
- Friendly Name → MyServer (SSH port)
- Hostname → my server's IP address
- Port → 22
- Same interval/retry settings as above
- I save
Testing
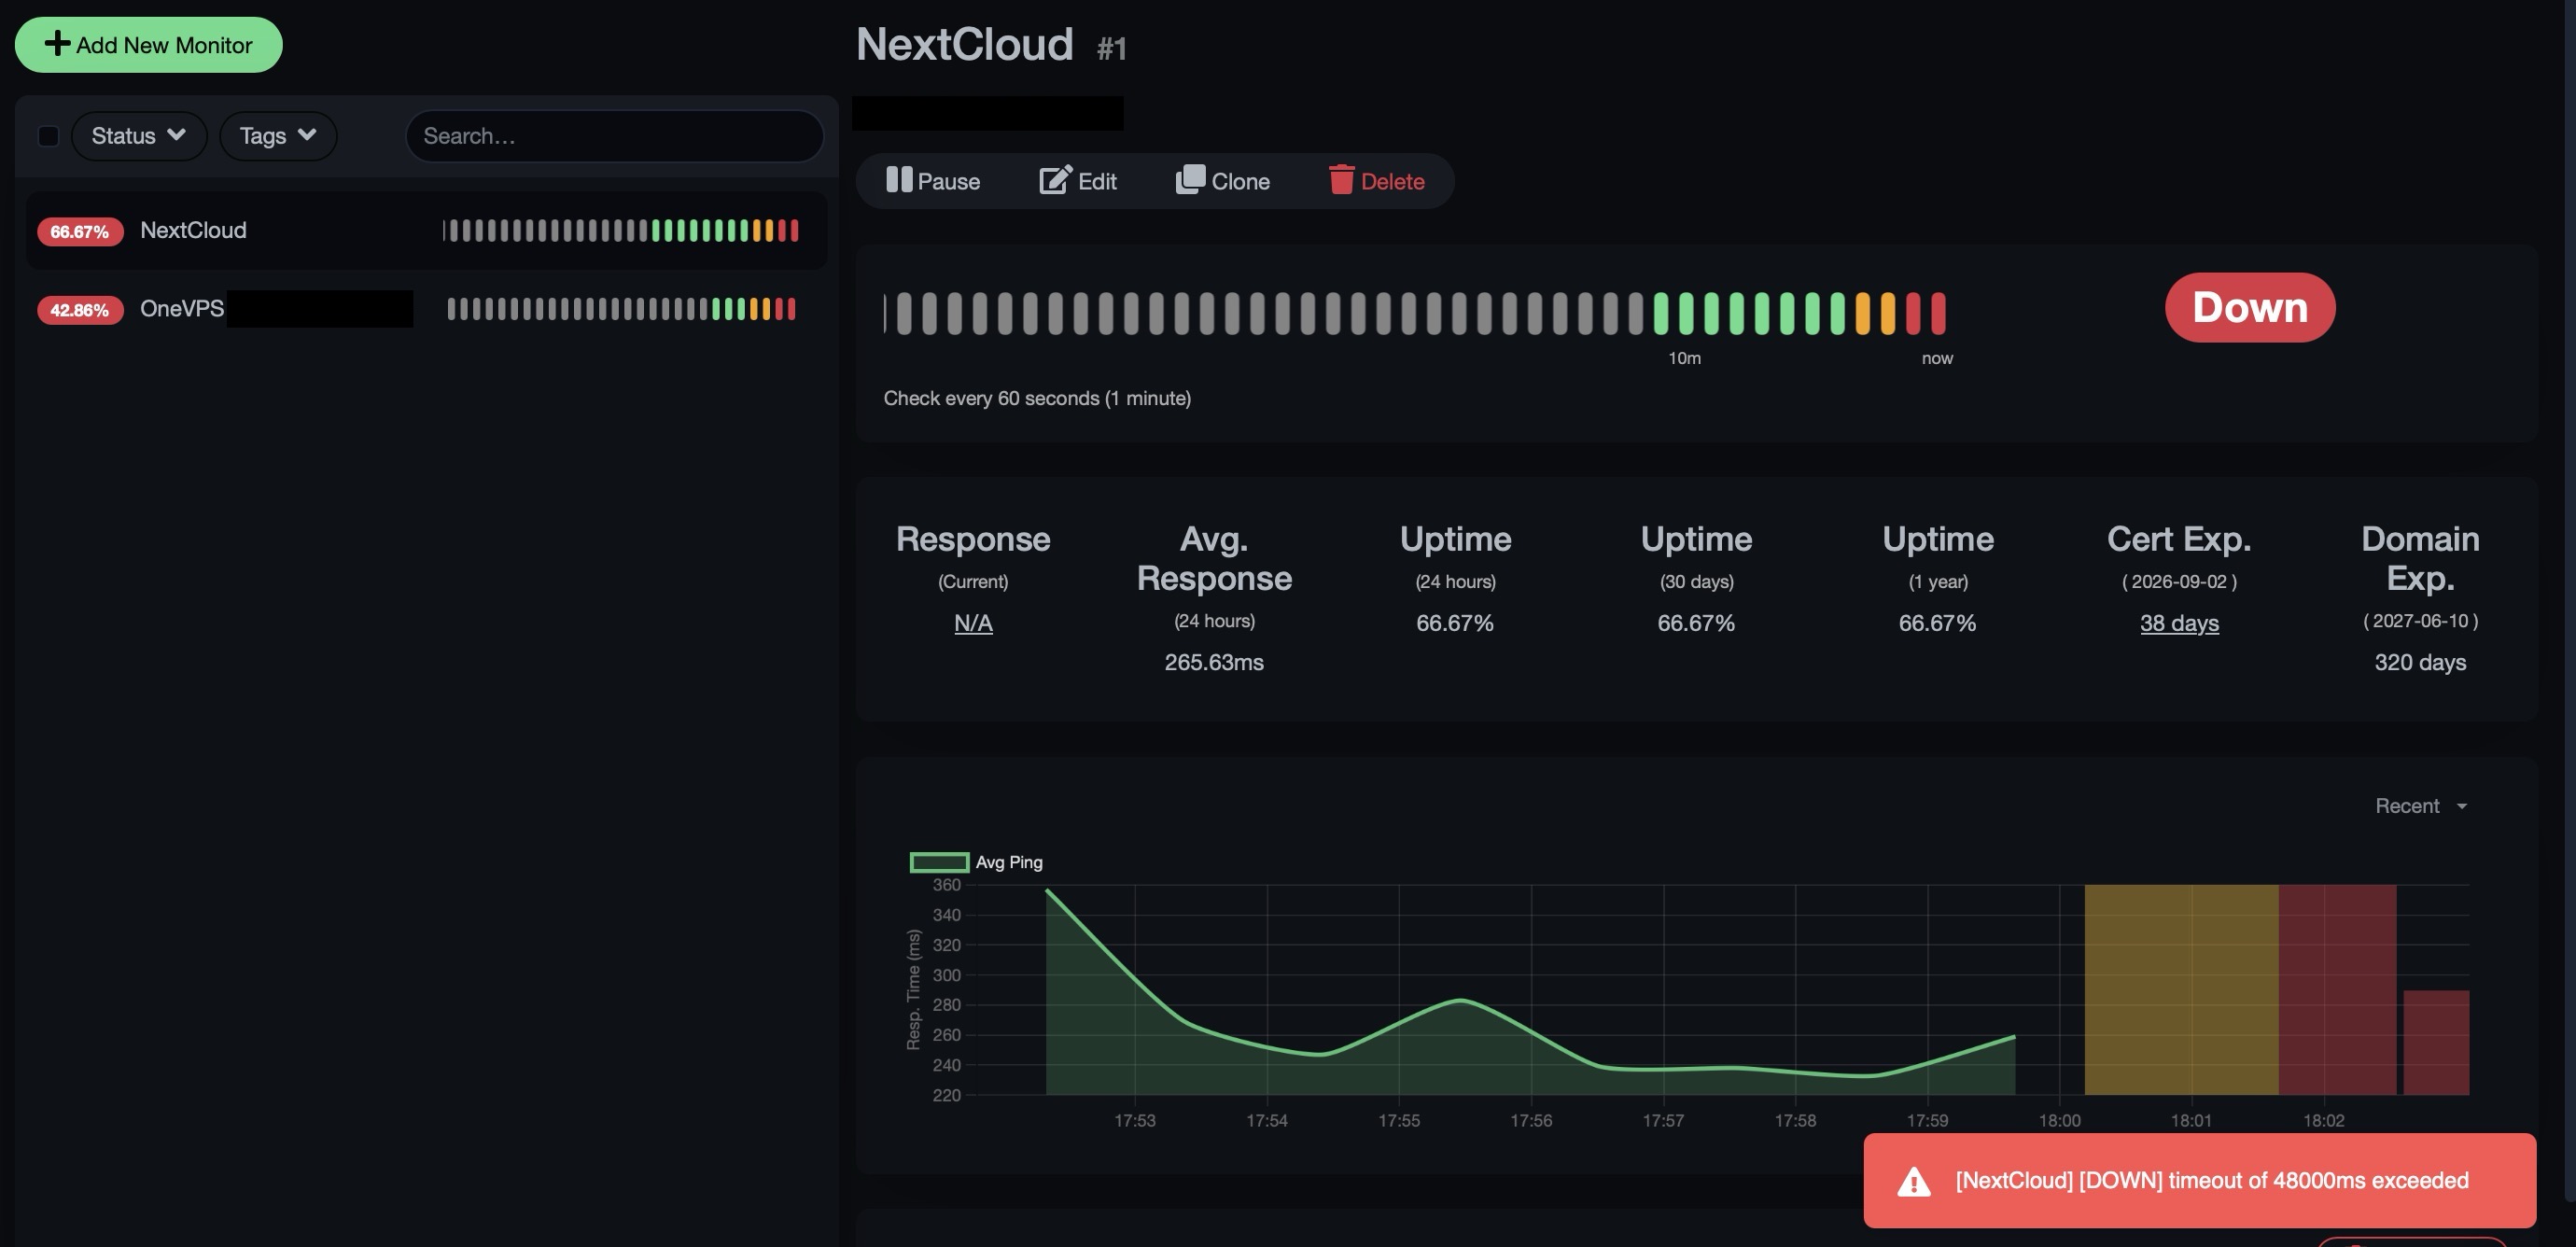
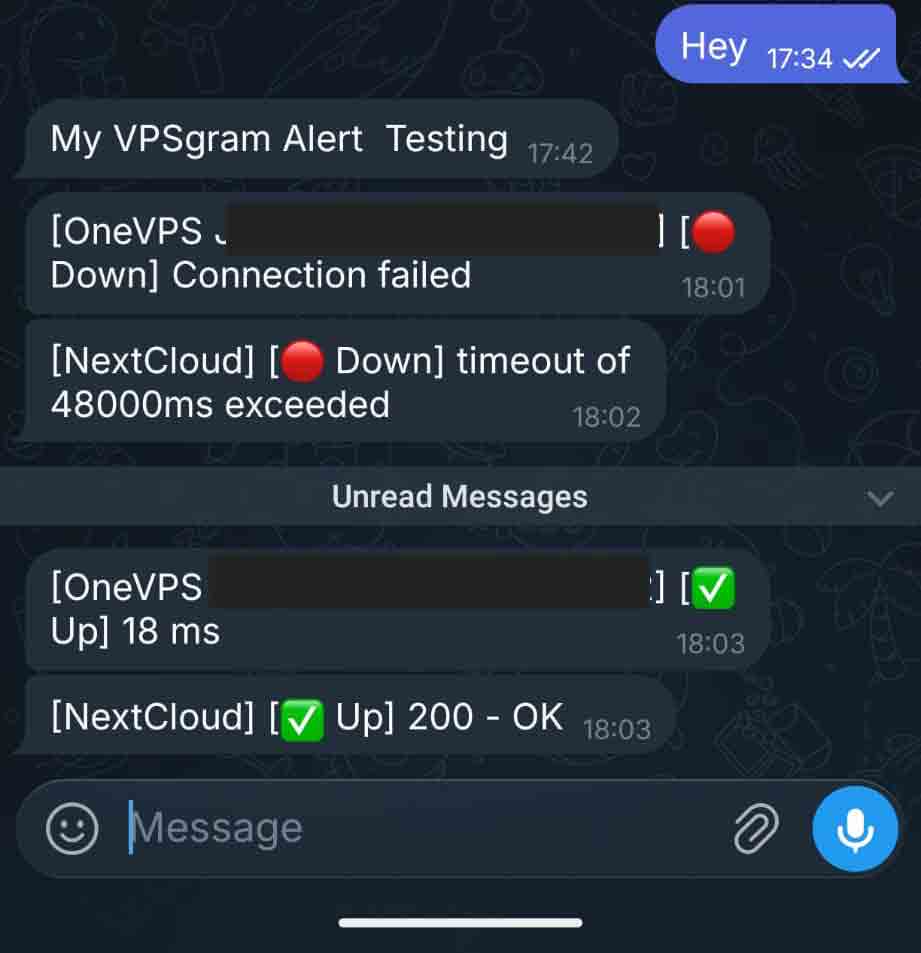
Easy to set up, and now I know when something is happening with my services pushed directly to my mobile phone.